Demand Breakdown Report
Demand Breakdown Report
- Found under the Overview section of the Reports page, the Demand Breakdown report allows you to monitor available units for your subscriptions and locations.
- View a breakdown of how many members are assigned to each pick-up location and how many of each share or option has been sold for the season.
- Subscriptions are listed without any defined order. Locations are listed alphabetically.
How should I download the report? PDF or CSV
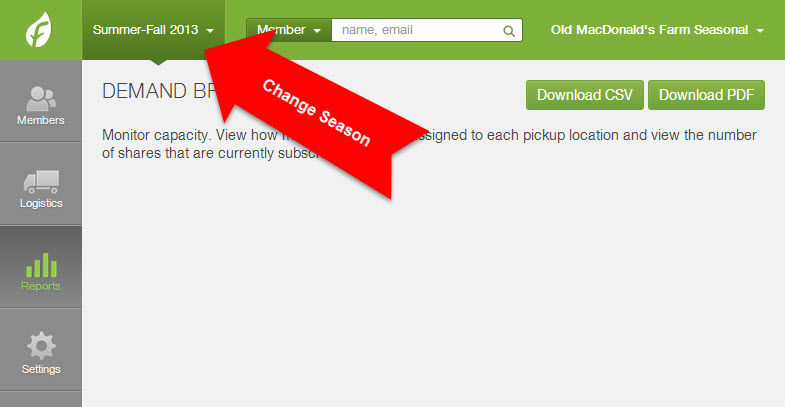
Select the season for which you would like to review the report from the upper left corner. Then choose to download the report as a PDF file or a CSV file.
PDF download is broken out into 2 pages
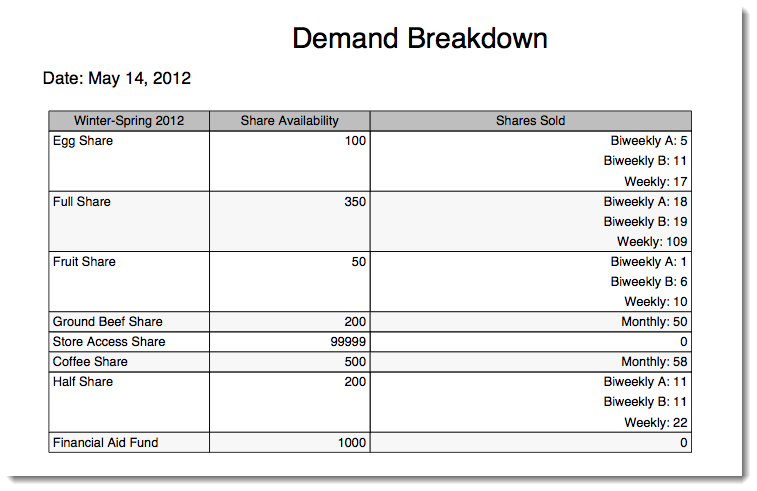
Page 1 - Subscription Demand Breakdown:
- Shows you the total number of shares and options available by breaking it down into columns for the number originally available and the number sold.
- To calculate the remaining available shares and options, subtract the Shares Sold column from the Share Availability column.
- The Shares Sold column will breakdown how many members signed up for each schedule. For example, below, the shares are sold weekly and biweekly.
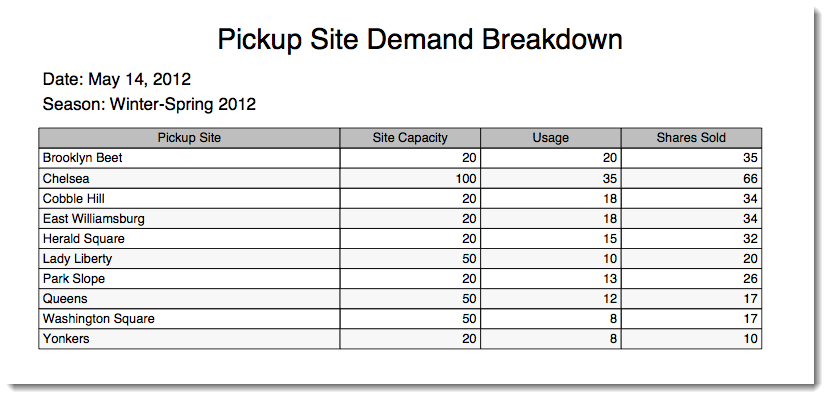
Page 2 - Pickup Site Demand Breakdown:
- Shows the capacity that you have listed for a location and how many members have an active subscription for that location, which is listed under "Usage".
- To calculate remaining capacity for a location, subtract Usage from Site Capacity.
- The Shares Sold column shows the total number of shares and options that members have subscribed to for that location.
- The breakdown does not include delivery zones.
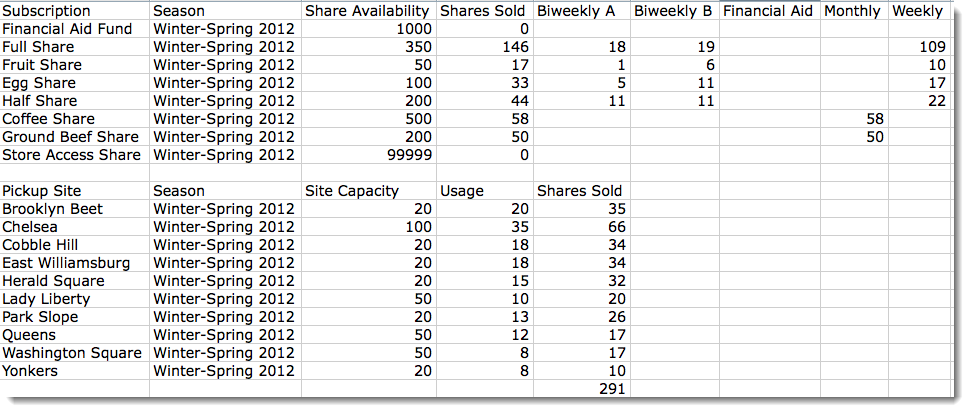
CSV file
The CSV report shows basically the same thing as the PDF but allows you to edit and do calculations in a spreadsheet if needed. CSV files are readable in most spreadsheet software programs, such as Excel.
Did this article answer your question?
You might also find these helpful
Still have questions?
Our support team is here.