Analytics
Home > Analytics Analytics allow you to quickly view key figures in your system to help you make informed strategic business decisions!
Total Deliveries: View the number of deliveries overtime
Click the View button in the top right corner to see the graph broken down by subscriptions and store orders. Deliveries of subscriptions (including shares and options) are represented by the green bars and store order deliveries are represented by the blue bars.
More detailed information may be found in the Past Deliveries (Quantity) report.
Deliveries Value: View the value of your deliveries overtime
Click the View button in the top right corner to see the graph broken down by subscriptions and store orders.Deliveries of subscriptions (including shares and options) are represented by the green bars and store order deliveries are represented by the blue bars.
The same information may be found in the Past Deliveries ($) report.
$ Received: View payments received overtime This bar chart shows you past cash flow. This information may also be reviewed using the Payments report.
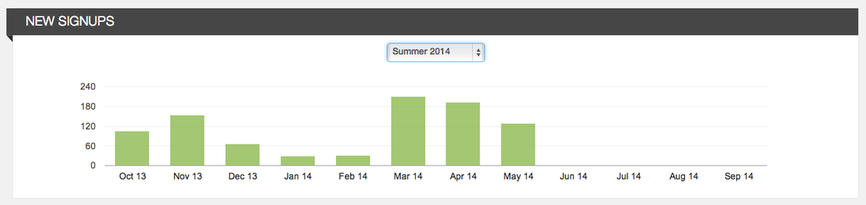
- Seasonal system view: In a seasonal system, you will see a chart that shows you quick stats on subscriptions in your active season. You can use the drop down to view stats on subscriptions in a past season. Scroll over any bar to see the exact number represented.
- Ongoing system view: In an ongoing system, you will see a chart that shows you quick stats on subscriptions in the last 12 months. You can navigate back/forward a month at a time to change which months you are viewing. Scroll over any bar to see the exact number represented.
New Signups: Compare number of signups overtime
Total Deliveries: View the number of deliveries overtime
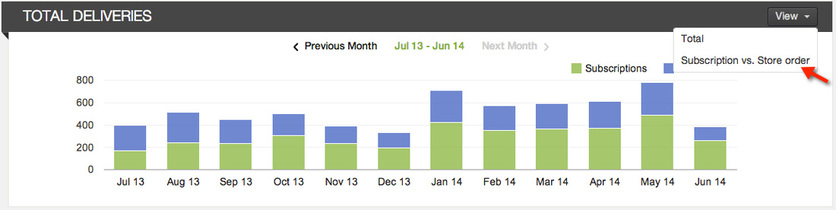
Click the View button in the top right corner to see the graph broken down by subscriptions and store orders. Deliveries of subscriptions (including shares and options) are represented by the green bars and store order deliveries are represented by the blue bars.
More detailed information may be found in the Past Deliveries (Quantity) report.
Deliveries Value: View the value of your deliveries overtime
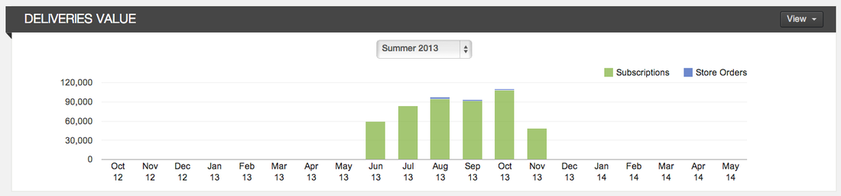
Click the View button in the top right corner to see the graph broken down by subscriptions and store orders.Deliveries of subscriptions (including shares and options) are represented by the green bars and store order deliveries are represented by the blue bars.
The same information may be found in the Past Deliveries ($) report.
$ Received: View payments received overtime This bar chart shows you past cash flow. This information may also be reviewed using the Payments report.
Did this article answer your question?
You might also find these helpful
Still have questions?
Our support team is here.